
November 15, 2026
Extended Producer Responsibility (EPR) in the UAE:...
Waste remains a business responsibility even after a product leaves the shelf....

A cardboard box is emptied. A plastic container is discarded. Packaging from a delivery ends up in a recycling bin. Once these materials leave day-to-day operations, it becomes surprisingly easy to lose sight of what happens next.
That creates a problem for businesses trying to understand Scope 3 emissions from waste. The type of material matters, as does the way it is handled after disposal. Waste composition can influence carbon emissions, while different materials may require different recycling, handling, or disposal processes.
Good tracking starts by following the waste itself.
A single monthly waste figure offers limited insight. Ten tonnes of mixed waste, for example, says nothing about how much is plastic, cardboard, food, metal, or another material.
That distinction matters. Waste composition can affect emissions from treatment, and the proportion of fossil and biogenic carbon in waste can vary according to the materials concerned. The efficiency of sorting can also affect the carbon reduction potential of waste treatment.
Packaging makes this especially clear. Warehouse packaging can contain cardboard, plastics, bubble wrap, Styrofoam, and pallets, and different materials can have different handling, recycling, or disposal requirements.
Effective scope 3 emissions tracking therefore needs more detail behind the headline waste number. Depending on the available data, useful information can include:
This changes the conversation around Scope 3 waste disposal. Instead of simply asking how much waste left the business, organisations can ask what left, how much of each material was involved, and where those materials went.
Packaging can easily disappear into general waste reporting even though it has its own material and lifecycle impacts.
Non-biodegradable packaging is identified as a high-volume waste stream in the UAE, while plastic packaging carries impacts which go beyond disposal. Plastic production involves petroleum extraction, refinement, and shaping, each of which contributes to carbon emissions and relies on fossil fuels.
That is why understanding a packaging carbon footprint calls for a wider view than counting discarded boxes or containers.
Lifecycle assessment considers raw materials, energy, processes, emissions, and waste across the life of a product or service. The inventory stage relies on data collection, validation, and calculation, while carbon impacts can ultimately be expressed as carbon dioxide equivalents for comparison.
But good calculations need good inputs. Hypothetical recycling rates can underestimate actual environmental impacts when they replace real recovery data. Differences in system boundaries and measurement approaches can also make results harder to compare.
For businesses, this makes data quality more than a reporting concern. It affects what they are able to learn from the numbers.
A stronger approach is to:
The same principle applies when selecting scope 3 reporting tools. A polished dashboard cannot compensate for weak underlying data. The value comes from making the journey from physical waste to environmental information clearer and more traceable.
Waste tracking does not have to remain a collection of spreadsheets, invoices, and end-of-month estimates.
Digital waste technologies are changing what can be observed. IoT sensors and data analytics can monitor bin fill levels and help identify areas for operational improvement. Smart bins have also been used for real-time monitoring of waste segregation, while AI applications in waste management include predictive analytics and machine learning-based material classification.
The result is a much richer view of waste activity than a total recorded at the end of the month. This is where eGreenBadge fits into the picture.
eGreenBadge combines AI, smart bins, digital tracking, and real-time analytics. Its technology identifies recyclable materials and packaging characteristics, estimates product weight and environmental impact, and records recycling activity. The platform also collects company- and product-level carbon data, including packaging impact and end-of-life emissions.
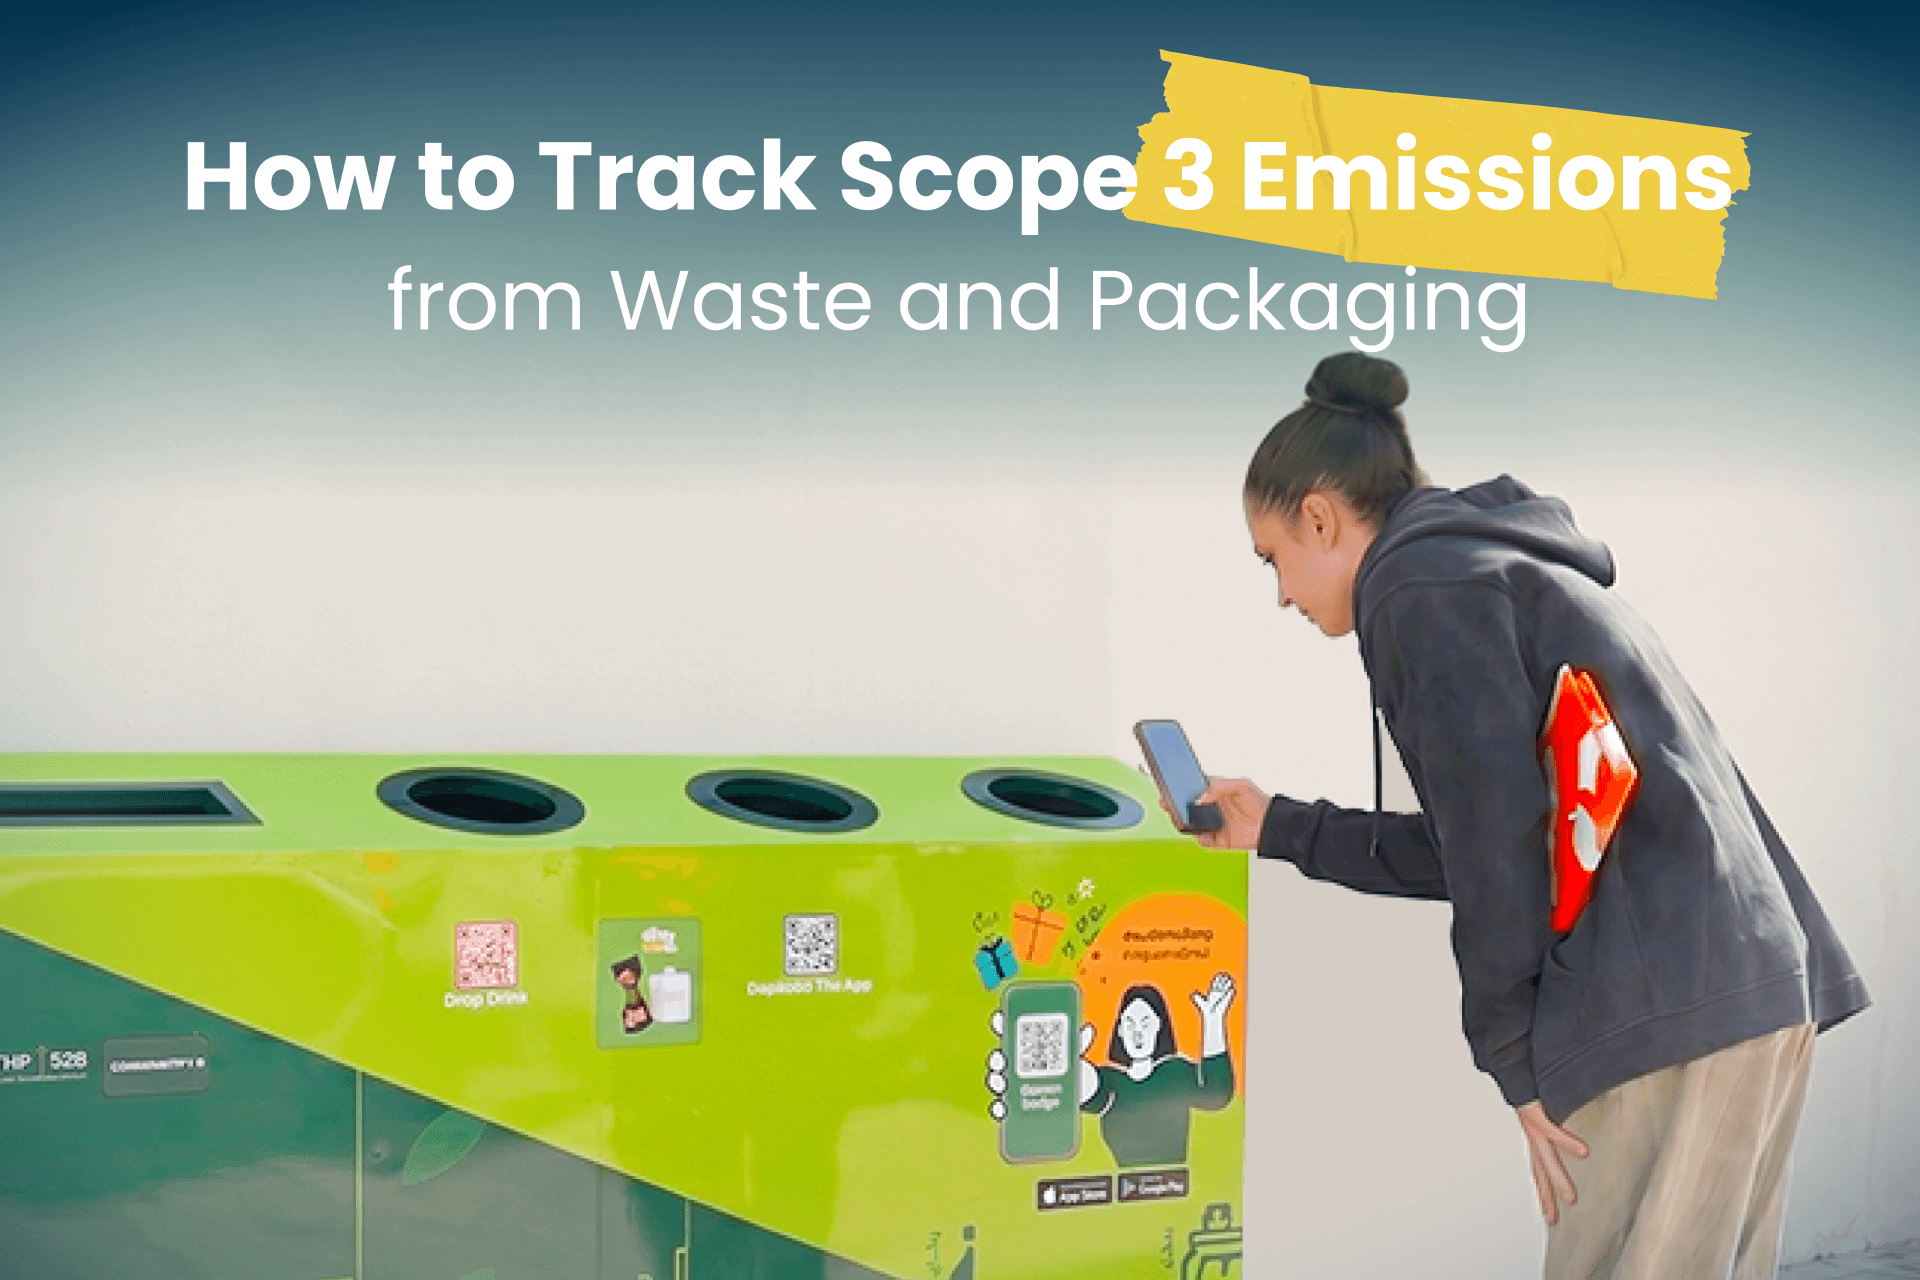
Its tracking process connects the physical recycling action with digital data. Items scanned through the eGreenBadge app are identified before being deposited into QR-coded smart bins. Material, location, and volume information is then logged and added to sustainability dashboards.
For businesses, that creates visibility into:
Get automated Scope 3 waste tracking insights and see how eGreenBadge brings waste activity, packaging information, carbon data, and recycling performance into a more measurable system.
The real value of tracking waste is not producing another number for a sustainability report. It is knowing enough about the waste stream to make the number useful.
When businesses can see what materials they discard, where those materials go, how much is recovered, and what the associated environmental data shows, waste stops being an invisible part of operations. It becomes something that can be measured, questioned, and improved.